Nistorescu Sorin
Active Member
For any given receiver/processor type, we can watch all the "Processor Load Statistics" (from GREIS) in NetView & Modem:
> %print,/par/load% {{PART, 0, 132, 1054, 146},
{PIFT, 0, 0, 0, 0},
{MEAT, 0, 11, 2966, 2754},
{FSMT, 0, 1, 428, 988},
{ACQT, 0, 19, 13842, 763},
{USBT, 0, 5, 9, 8100},
{WINI, 0, 0, 0, 0},
{WLAN, 0, 0, 0, 0},
{KFKS, 0, 0, 2, 162},
{PPP0, 0, 0, 0, 0},
{TCLA, 0, 0, 0, 0},
{TCLB, 0, 0, 0, 0},
{DDNS, 0, 0, 0, 0},
{BLTH, 0, 0, 0, 0},
{APPX, 3, 85, 19040, 806},
{NALR, 0, 0, 0, 0},
{MCUR, 0,128364,132487, 17},
{TCPT, 0, 4, 5, 81},
{Idle,82, 0, 0, 0},
{aisr,12, 39, 207,123603},
{LOAD,18, 33, 33, 449}} OK
We are experiencing a period of major changes regarding the complexity of the GNSS signals that ultimately overload the processor(s) in our receivers, so a real-time CPU performance tracking chart could give us some clues about behavior of our GNSS receiver versus new upcoming signals, soft/hard real-time errors (special interest to the user), etc.
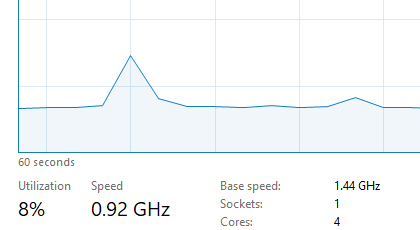
Something similar to Task Manager/CPU Performance graph in our Windows computers. Applicable for NetView & Modem, J-Field, JMT and apologies if the GNSS CPU monitor is already implemented somewhere..

By the way, that TRIUMPH Chip Data Sheet is from 2008. We should have more current publications about Triumph 2/3 chips.
> %print,/par/load% {{PART, 0, 132, 1054, 146},
{PIFT, 0, 0, 0, 0},
{MEAT, 0, 11, 2966, 2754},
{FSMT, 0, 1, 428, 988},
{ACQT, 0, 19, 13842, 763},
{USBT, 0, 5, 9, 8100},
{WINI, 0, 0, 0, 0},
{WLAN, 0, 0, 0, 0},
{KFKS, 0, 0, 2, 162},
{PPP0, 0, 0, 0, 0},
{TCLA, 0, 0, 0, 0},
{TCLB, 0, 0, 0, 0},
{DDNS, 0, 0, 0, 0},
{BLTH, 0, 0, 0, 0},
{APPX, 3, 85, 19040, 806},
{NALR, 0, 0, 0, 0},
{MCUR, 0,128364,132487, 17},
{TCPT, 0, 4, 5, 81},
{Idle,82, 0, 0, 0},
{aisr,12, 39, 207,123603},
{LOAD,18, 33, 33, 449}} OK
We are experiencing a period of major changes regarding the complexity of the GNSS signals that ultimately overload the processor(s) in our receivers, so a real-time CPU performance tracking chart could give us some clues about behavior of our GNSS receiver versus new upcoming signals, soft/hard real-time errors (special interest to the user), etc.
Something similar to Task Manager/CPU Performance graph in our Windows computers. Applicable for NetView & Modem, J-Field, JMT and apologies if the GNSS CPU monitor is already implemented somewhere..
By the way, that TRIUMPH Chip Data Sheet is from 2008. We should have more current publications about Triumph 2/3 chips.
