School Project

Tyler

Member
I was curious if anyone can think of good ideas for a Senior Project regarding use of RTK Surveying, more specifically with the use of a Triumph LS and T1M Base. The project would need to contain a field portion and an analysis portion. I am interested in relating this project to accuracies in boundary retracement but I would like to hear any and all other ideas. The LS and base unit that I currently have access to can access Beidou and Galileo satellites which open up some possibilities for ideas. Thanks!
 

Nate The Surveyor

Well-Known Member
I'd suggest a critical analysis of meeting min stds for accuracy.
Pre set up a course. Observe about 5-10 points. Then look at relative accuracy. Then re observe, and look again. Then re observe, and show how statisticaly you meet min stds.
My reasoning for this is the big question, can I meet min stds with rtk, and, how redundancy affects things.
This would be for a mature audience. Who is in college.
N
 

Shawn Billings

Shawn Billings
5PLS
Along with Matt's suggestion of grid/ground distances you could also add convergence of meridians.

Another thought is to demonstrate the many ways a surveyor might make an error that causes a State plane coordinate to be incorrect and the magnitude of each type of error. Wrong datum, wgs84 vs nad83. Autonomous base. Wrong epoch, 86 vs 93 vs 2002 vs 2011. Scaled at 0,0. Scaled at local. Scaled by only scale factor and not elevation factor too. Scaled area by combined factor not combined factor squared. And of course magnitude of a bad fix compared to a good fix.

All of these will be important to a young surveyor trying to determine how a coordinate might be wrong.
 

Tyler

Member
I have decided to proceed with a project analyzing the relative positional accuracy of RTK surveying, using the Javad LS and Triumph 1-M, and determine if it can meet the standards of accuracy as stated in the ALTA standards for boundary surveying. I would also like to see how these accuracies change in more "difficult" environments since I am frequently performing boundary surveys in wooded, hilly areas. Perhaps I can setup a course of a few points as @Nate The Surveyor has suggested in an area under canopy, then run a conventional traverse to gain a strong geometric figure and compare the results of the RTK vectors to this. Then I could check how repeated measurements with RTK help to narrow down the relative accuracy and can be used to potentially meet ALTA standards.. or not. I want to see if it can be done in the open as well but I only have so much free time on my hands!
 

Tyler

Member
Update on my project:
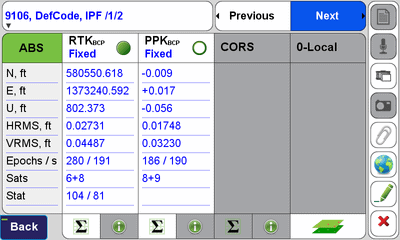
Set eight control points, two are in difficult locations (under tree canopy/other obstructions) and the other six are in areas that are mostly free of overhead obstructions. Ran a traverse through the eight control points and double tied each one. Traverse closure <0.01 horizontal and vertical. Set up GPS base (Triumph 1-m) in a wide open area. Initially double tied each control point.. then went through about 4 hours later and took another measurement on the control points to compare redundant measurements back to back vs after a new satellite geometry. Two of the shots in the most difficult location did not verify but had at least 3600 seconds of RTK fixed time. Which leads me to a few questions..

1. How can I determine how much time was actually necessary to provide a reasonable position on this difficult measurement? An hour certainly seems like an excessive amount of time to collect data on a point.

2. There are many ways to evaluate the data I have gathered but I'm having trouble figuring out what is the most useful way to display my findings. What are the most useful reports/tools for displaying my results for others?

3. How is the relative positional accuracy tool establishing its "known value"? Is it just comparing the other shots to the first measurement?


I've begun processing the field work in StarNet v9. After running all of the data, conventional and GPS vectors, I have exceeded the upper bounds of my chi-square test slightly. When I remove the GPS vectors from the two difficult control points it passes the test. In all cases though the data passes the positional tolerance check of 0.07' + 50ppm. However, I'm mainly trying to determine if this could be met with ONLY gps data. What are the best methods for showing this in your opinion?

*I will post any of the data that people are interested in seeing, just let me know.
 

T.Guisewhite

Active Member
Continuing from the StarNet thread...

So if I was wanting to compare a terrestrial data set to a Javad dataset to see the differences. I think I would do something like this:

You have your TS traverse... (sounds like your errors were basically non existent) but I would go ahead and compass rule it this to produce the “TS Data Set.”

then you have your GNSS data set with redundancy at each position. This “raw” is the “GNSS Data Set.”

I would go ahead and process the entire project in StarNet combining the total station and GNSS raw data in a correctly...real world weighted adjustment. This produces the “Adjusted Data Set”

in Carlson survey there is a least squares coordinate transformation tool that compares two data sets and outputs a least squares best fit depending on what you hold fixed...and it yields a really nice reporting spreadsheet with all the residuals.

what I would suggest is taking the “Adjusted Data Set” and running the transformation on the “TS Data Set”. The result will be your total station data overlaid but untouched by the GNSS data. Call this the “TS Adjusted Data Set”

This data set will be “best fit” to the real world coordinates of the StarNet adjustment but maintain the geometry measured by the total station.
The output residuals of this first transformation routine will tell you the affects that GNSS data have on total station measurements. If the weights in StarNet were correct these residuals will be super small... like a back sight check on adjusted control (0.015’ ish.) because your TS data on a closed traverse should have more weight in the adjustment.

next you would take the “TS Adjusted Data Set” and run the coordinate transformation on the “GNSS Data Set.” (I’ve never tried but it would be best to not let it apply any rotation to this transformation...since you don’t want it to rotate the GNSS) The output residuals of this least squares comparison is in my opinion what you are after.

this method will basically be using “all” the data to take any positional or rotational “play” out of your “known” values of the total station traverse so you can then see the comparison to the raw GNSS derived positions.

you’re using all of your data to create a set of “known” values that you can then back compare to the raw GNSS data.

if you want I can screen share with you some time this coming week and show you this in StarNet & Carlson.

probably a couple of ways out there to basically do the same thing but the reporting that Carlson gives is pretty good.
 

Tyler

Member
probably a couple of ways out there to basically do the same thing but the reporting that Carlson gives is pretty good.

This sounds like it would definitely be the way to go for comparing my data. I would be very interested in having you show me how this would work in StarNet and Carlson. Thank you for the detailed post!
 

Tyler

Member
Perhaps I should be trying to compare the two in the LS as well? I wonder if the localization tool would be able to provide a good comparison of the two.
 

T.Guisewhite

Active Member
It would be interesting to see the differences and compare.


here’s a thread I posted when I first got my LS... it’s similar to what you are trying to report. You can get a glimpse of the Carlson reporting and transformation screenshots in there.
 

Adam

Well-Known Member
5PLS
Perhaps I should be trying to compare the two in the LS as well? I wonder if the localization tool would be able to provide a good comparison of the two.
Yes it would. The localization feature is basically a geometry comparison tool. Import the ts points and pair them up with the GNSS points and you will see the residuals. You can also see the parameters after hitting save or customize.
 

Tyler

Member
Yes it would. The localization feature is basically a geometry comparison tool. Import the ts points and pair them up with the GNSS points and you will see the residuals. You can also see the parameters after hitting save or customize.
I will be trying this out tomorrow!
 
Top